Introduction
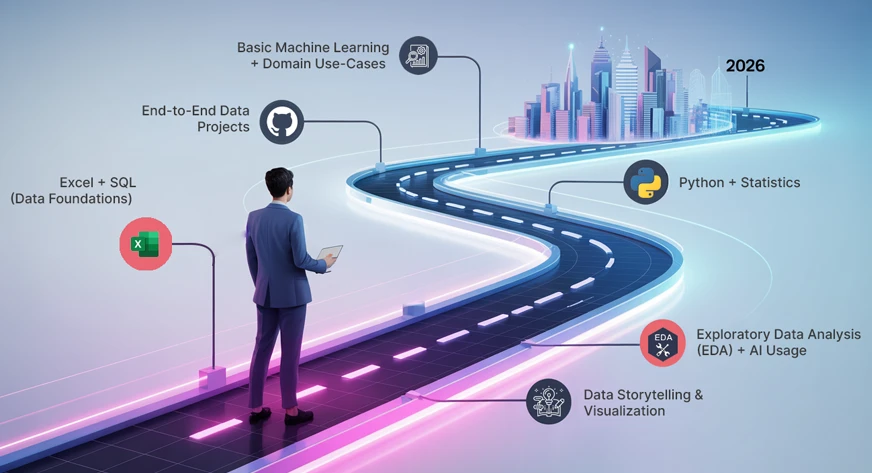
Data analytics has moved from being a niche skill to a core business requirement across industries. In 2026, organisations rely heavily on data analysts to interpret trends, optimise operations, and support decision-making. For beginners, this creates a strong opportunity—but only if learning is structured and goal-oriented. This roadmap breaks down a 12-month journey for aspirants starting from zero technical background. It focuses on building skills gradually, applying them in real scenarios, and becoming job-ready by the end of one year.
Months 1–3: Building Core Foundations
The first three months should focus on understanding what data analytics actually involves. At this stage, the goal is not speed but clarity.
Start with basic mathematics and statistics. Topics such as averages, percentages, probability, variance, and correlation are essential. These concepts appear repeatedly in analysis and reporting, so conceptual understanding matters more than memorisation.
Next, move to spreadsheet tools like Excel or Google Sheets. Learn formulas, sorting, filtering, pivot tables, and basic charts. These tools are still widely used in companies for quick analysis and reporting.
At the same time, develop business thinking. Understand how data supports functions like marketing, finance, operations, and HR. Beginners who combine technical learning with business context tend to progress faster.
Many learners choose a structured learning path at this stage through a data analysis course in Pune, as it provides guided coverage of fundamentals along with practical exposure. However, self-learning is also possible if discipline and consistency are maintained.
Months 4–6: Learning SQL, Python, and Data Handling
Once the basics are clear, the next phase focuses on tools that handle real-world data volumes.
SQL should be your first priority. Learn how to retrieve data using SELECT statements, apply filters, perform joins, use aggregations, and write subqueries. SQL is a non-negotiable skill for most analyst roles.
Once you know SQL, start learning Python for data analysis. Focus on libraries like Pandas and NumPy. Learn to clean data, deal with missing values, make changes to data, and do simple analysis. Don’t worry about advanced machine learning yet—just use Python for analysis.
You should also learn about data cleaning and preprocessing, as real datasets are often messy. Understanding how to prepare data for analysis is a key industry expectation.
Learners enrolled in a structured data analyst course often start working on guided mini-projects during this phase, which helps connect tools with practical use cases.
Months 7–9: Visualisation, Projects, and Domain Exposure
By the seventh month, the focus should shift from learning tools to applying them.
Start with data visualisation tools such as Power BI or Tableau. Learn to create dashboards, use filters, build calculated fields, and tell a story using charts. The ability to communicate insights visually is a critical skill for analysts.
Parallelly, begin working on end-to-end projects. These projects should involve data collection, cleaning, analysis, and presentation. Choose datasets related to domains such as sales, finance, supply chain, or customer behaviour.
This is also the right time to develop domain understanding. For example, if you are interested in marketing analytics, learn key metrics like conversion rates and customer acquisition cost. Domain familiarity improves interview performance and workplace effectiveness.
By the end of this phase, you should have at least three solid projects that demonstrate your analytical thinking.
Months 10–12: Portfolio, Interview Preparation, and Job Search
The final quarter is about positioning yourself for employment.
Create a strong portfolio that includes project summaries, dashboards, and insights. Host your work on GitHub or a personal portfolio website. Employers value clarity of thought more than complex models.
Prepare for interviews by revising SQL queries, statistics concepts, and case-based questions. Practise explaining your projects clearly, focusing on problem statements, approach, and outcomes.
At this stage, many candidates consider formal validation through a recognised data analysis course in Pune to strengthen credibility and placement readiness, especially if they are career switchers.
Finally, start applying strategically. Tailor resumes for analyst roles, apply consistently, and use professional networks to explore opportunities.
Conclusion
Becoming a data analyst in 2026 does not require prior coding experience, but it does demand structure, patience, and consistent effort. This 12-month roadmap provides a practical path—from fundamentals to job readiness—without unnecessary complexity. Whether you choose self-learning or guided training through a data analyst course, the key lies in building strong foundations, practising with real data, and developing the ability to communicate insights clearly. With focused execution, a career in data analytics is an achievable goal within one year.
Business Name: ExcelR – Data Science, Data Analyst Course Training
Address: 1st Floor, East Court Phoenix Market City, F-02, Clover Park, Viman Nagar, Pune, Maharashtra 411014
Phone Number: 096997 53213
Email Id: enquiry@excelr.com
